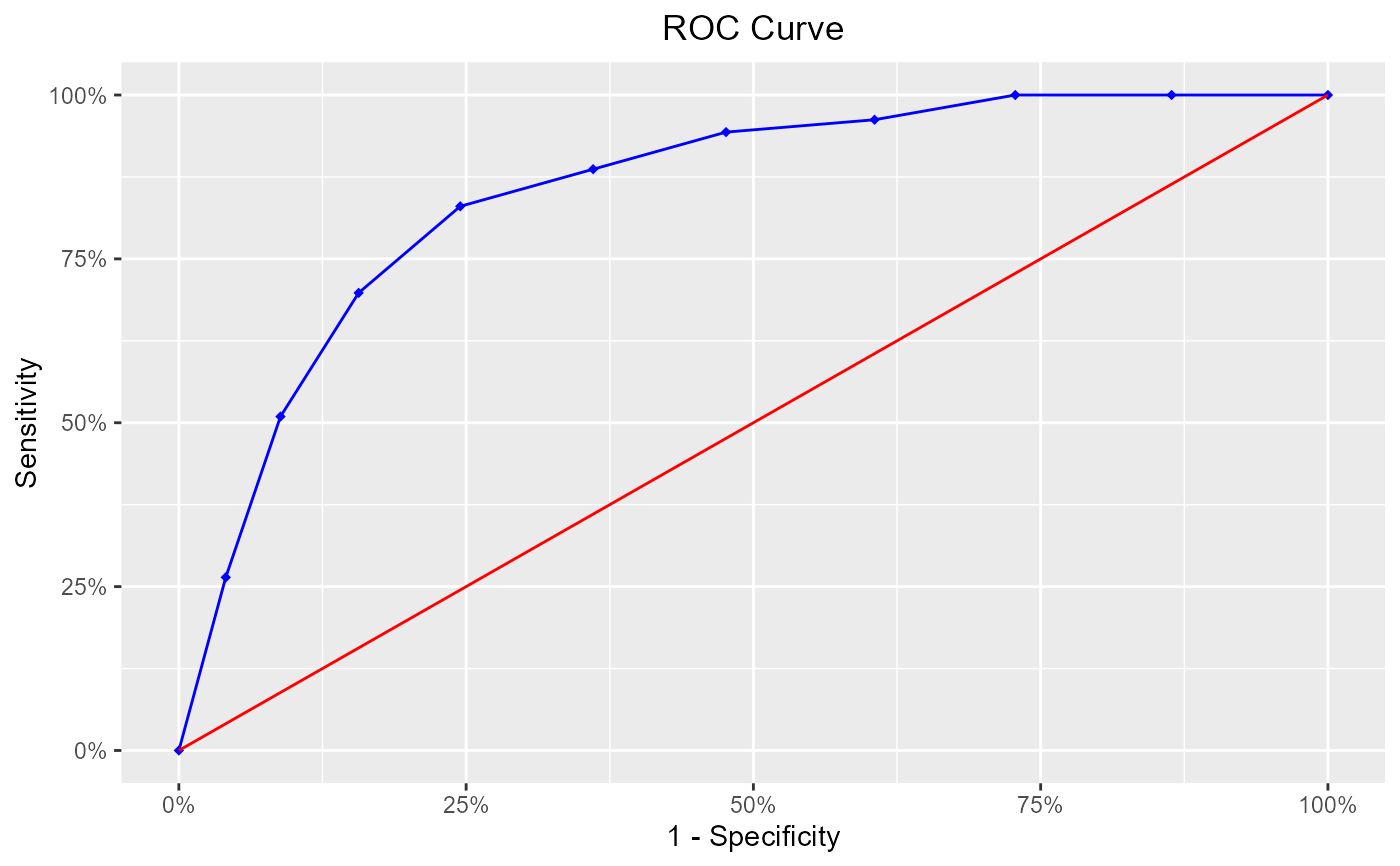
Receiver operating characteristic curve (ROC) curve is used for assessing accuracy of the model classification.
Usage
blr_roc_curve(
  gains_table,
  title = "ROC Curve",
  xaxis_title = "1 - Specificity",
  yaxis_title = "Sensitivity",
  roc_curve_col = "blue",
  diag_line_col = "red",
  point_shape = 18,
  point_fill = "blue",
  point_color = "blue",
  plot_title_justify = 0.5,
  print_plot = TRUE
)
Arguments
- gains_table
An object of class
blr_gains_table.- title
Plot title.
- xaxis_title
X axis title.
- yaxis_title
Y axis title.
- roc_curve_col
Color of the roc curve.
- diag_line_col
Diagonal line color.
- point_shape
Shape of the points on the roc curve.
- point_fill
Fill of the points on the roc curve.
- point_color
Color of the points on the roc curve.
- plot_title_justify
Horizontal justification on the plot title.
- print_plot
logical; if
TRUE, prints the plot else returns a plot object.
References
Agresti, A. (2007), An Introduction to Categorical Data Analysis, Second Edition, New York: John Wiley & Sons.
Hosmer, D. W., Jr. and Lemeshow, S. (2000), Applied Logistic Regression, 2nd Edition, New York: John Wiley & Sons.
Siddiqi N (2006): Credit Risk Scorecards: developing and implementing intelligent credit scoring. New Jersey, Wiley.
Thomas LC, Edelman DB, Crook JN (2002): Credit Scoring and Its Applications. Philadelphia, SIAM Monographs on Mathematical Modeling and Computation.
See also
Other model validation techniques:
blr_confusion_matrix(),
blr_decile_capture_rate(),
blr_decile_lift_chart(),
blr_gains_table(),
blr_gini_index(),
blr_ks_chart(),
blr_lorenz_curve(),
blr_test_hosmer_lemeshow()
Examples
model <- glm(honcomp ~ female + read + science, data = hsb2,
             family = binomial(link = 'logit'))
k <- blr_gains_table(model)
blr_roc_curve(k)