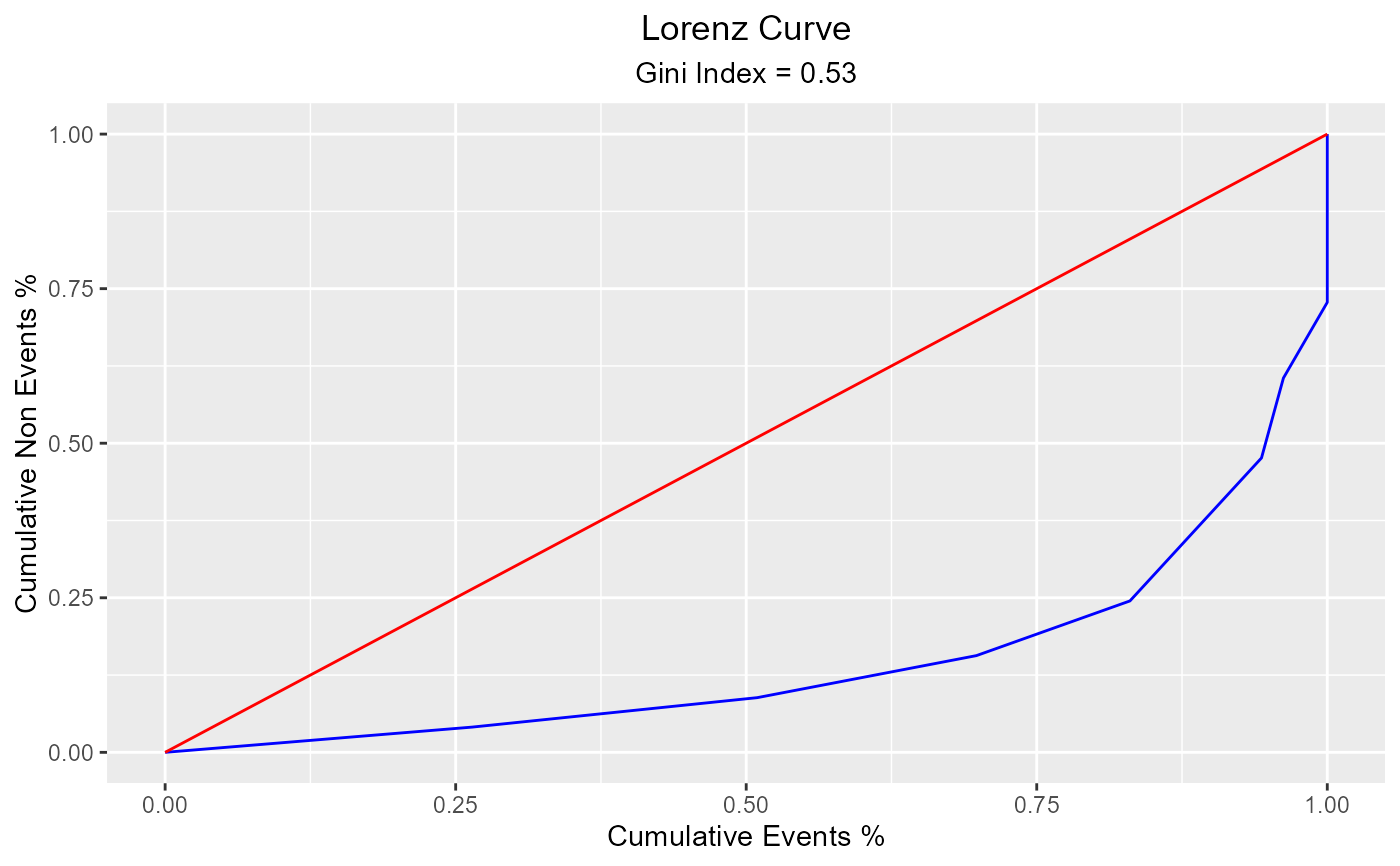
Lorenz curve is a visual representation of inequality. It is used to measure the discriminatory power of the predictive model.
Usage
blr_lorenz_curve(
  model,
  data = NULL,
  title = "Lorenz Curve",
  xaxis_title = "Cumulative Events %",
  yaxis_title = "Cumulative Non Events %",
  diag_line_col = "red",
  lorenz_curve_col = "blue",
  print_plot = TRUE
)See also
Other model validation techniques:
blr_confusion_matrix(),
blr_decile_capture_rate(),
blr_decile_lift_chart(),
blr_gains_table(),
blr_gini_index(),
blr_ks_chart(),
blr_roc_curve(),
blr_test_hosmer_lemeshow()