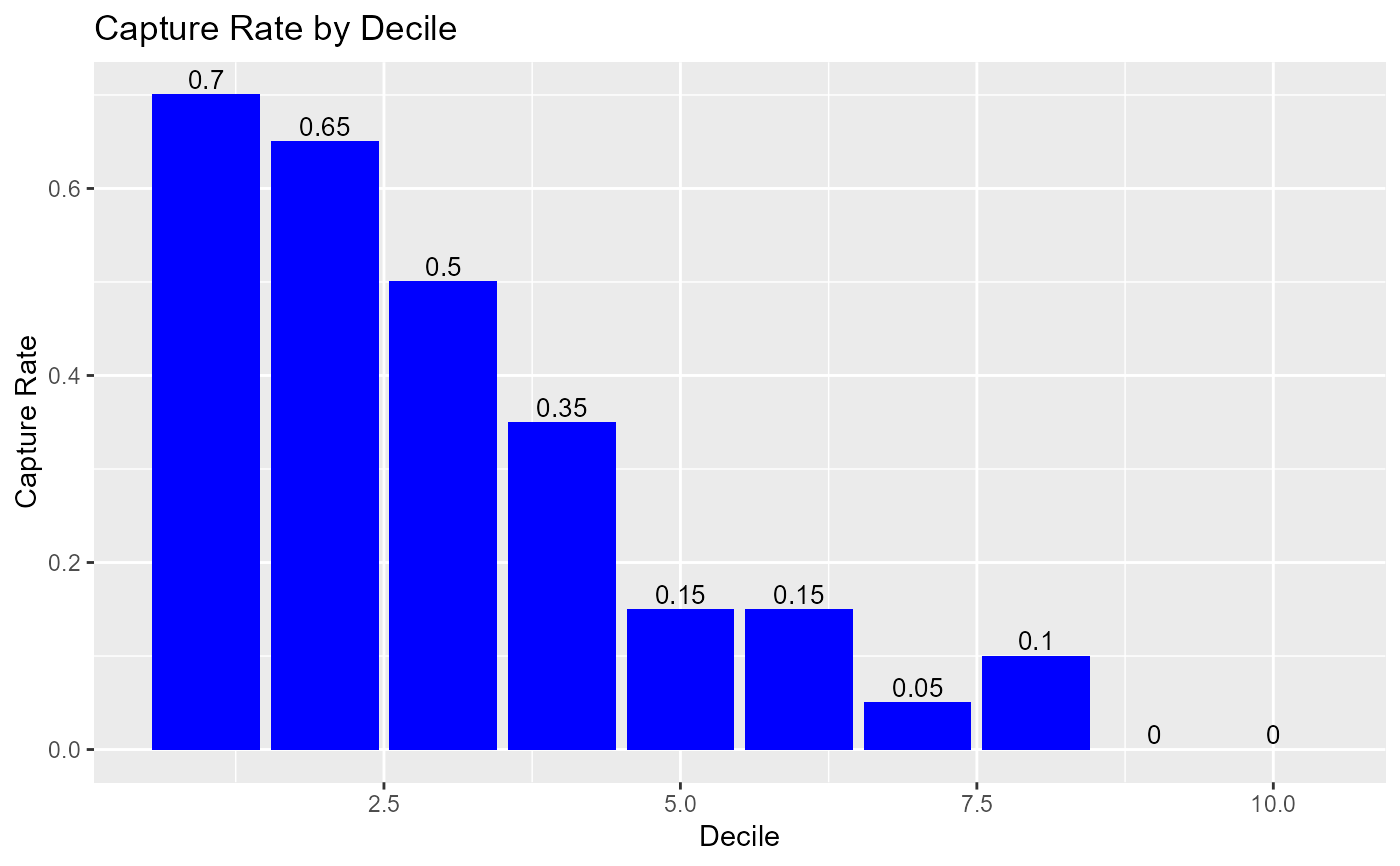
Visualize the decile wise event rate.
Usage
blr_decile_capture_rate(
  gains_table,
  xaxis_title = "Decile",
  yaxis_title = "Capture Rate",
  title = "Capture Rate by Decile",
  bar_color = "blue",
  text_size = 3.5,
  text_vjust = -0.3,
  print_plot = TRUE
)See also
Other model validation techniques:
blr_confusion_matrix(),
blr_decile_lift_chart(),
blr_gains_table(),
blr_gini_index(),
blr_ks_chart(),
blr_lorenz_curve(),
blr_roc_curve(),
blr_test_hosmer_lemeshow()
Examples
model <- glm(honcomp ~ female + read + science, data = hsb2,
             family = binomial(link = 'logit'))
gt <- blr_gains_table(model)
blr_decile_capture_rate(gt)