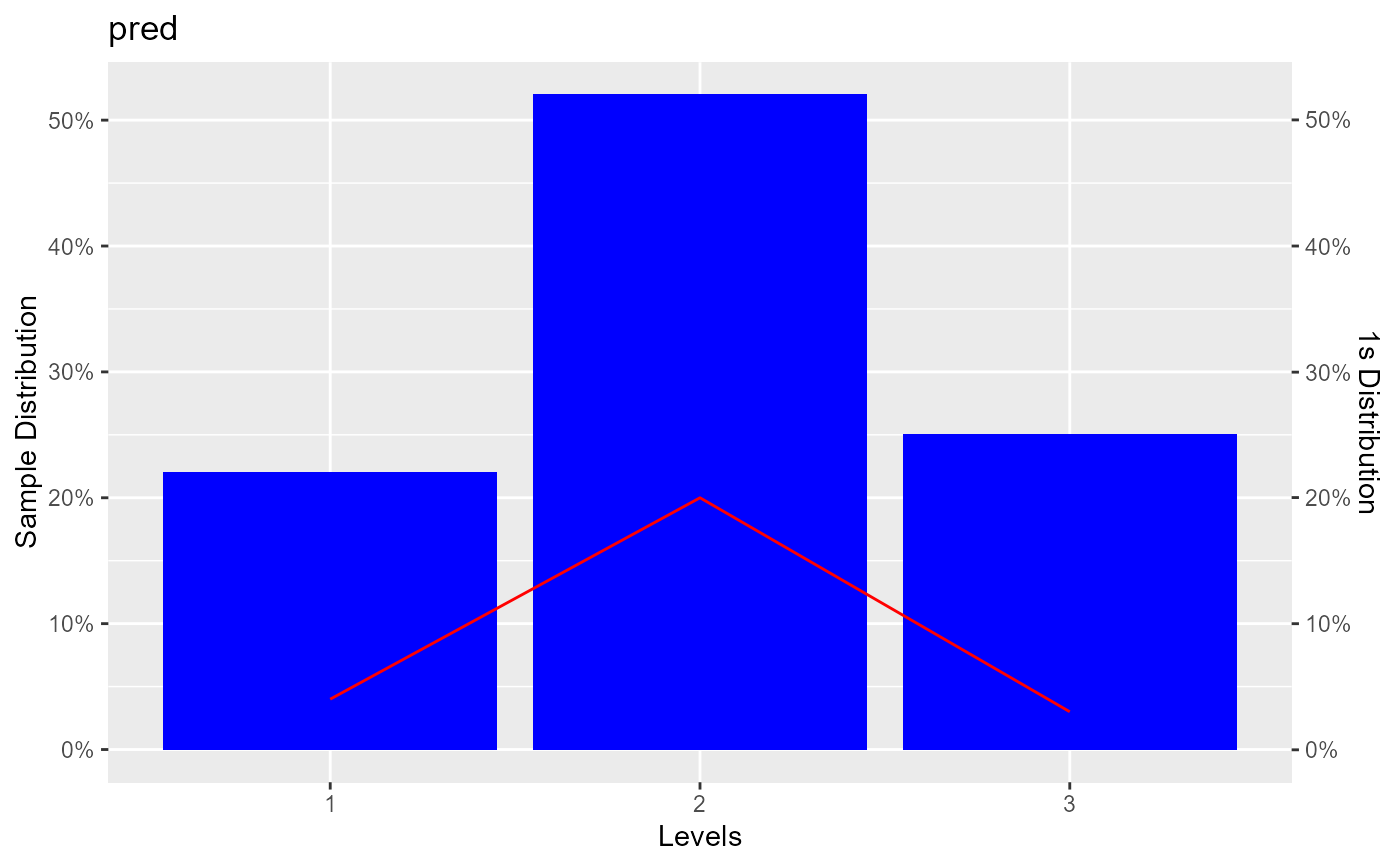
Distribution of response variable by segements/levels of a qualitative variable.
Usage
blr_segment_dist(data, response, predictor)

# S3 method for class 'blr_segment_dist'
plot(
  x,
  title = NA,
  xaxis_title = "Levels",
  yaxis_title = "Sample Distribution",
  sec_yaxis_title = "1s Distribution",
  bar_color = "blue",
  line_color = "red",
  print_plot = TRUE,
  ...
)
Arguments
- data
A
tibbleor adata.frame.- response
Response variable; column in
data.- predictor
Predictor variable; column in
data.- x
An object of class
blr_segment_dist.- title
Plot title.
- xaxis_title
X axis title.
- yaxis_title
Y axis title.
- sec_yaxis_title
Secondary y axis title.
- bar_color
Bar color.
- line_color
Line color.
- print_plot
logical; if
TRUE, prints the plot else returns a plot object.- ...
Other inputs.
See also
Other bivariate analysis procedures:
blr_bivariate_analysis(),
blr_segment(),
blr_segment_twoway(),
blr_woe_iv(),
blr_woe_iv_stats()
Examples
k <- blr_segment_dist(hsb2, honcomp, prog)
k
#>          Event Segmentation
#> -------------------------------------
#>   pred       n     1s     n%     1s%
#> -------------------------------------
#>    1        45     7     0.22    0.04
#>    2        105    40    0.52    0.20
#>    3        50     6     0.25    0.03
#> -------------------------------------
#>

# plot
plot(k)