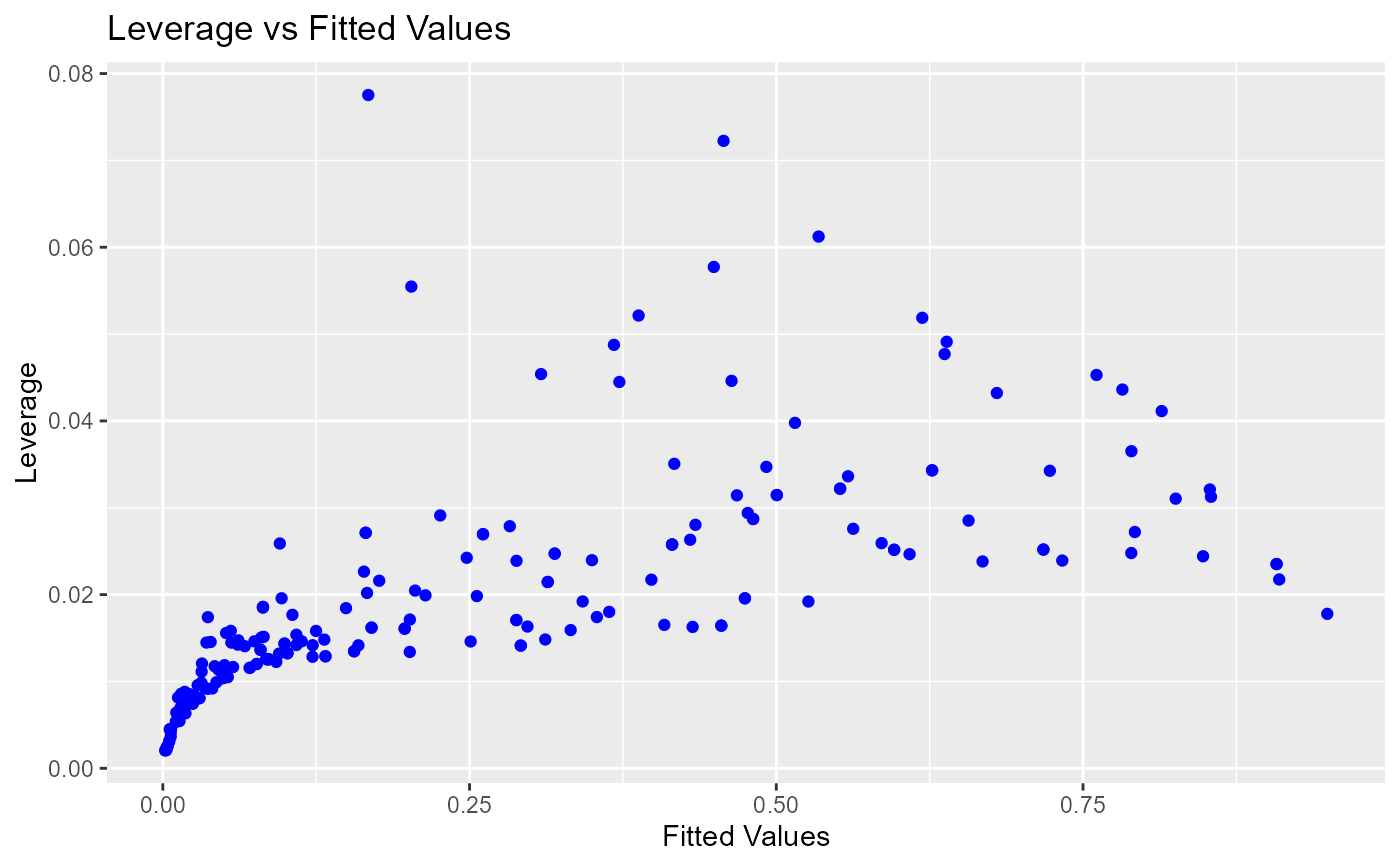
Leverage vs fitted values plot
blr_plot_leverage_fitted(
  model,
  point_color = "blue",
  title = "Leverage vs Fitted Values",
  xaxis_title = "Fitted Values",
  yaxis_title = "Leverage"
)
Arguments
| model | An object of class |
|---|---|
| point_color | Color of the points. |
| title | Title of the plot. |
| xaxis_title | X axis label. |
| yaxis_title | Y axis label. |
Examples
model <- glm(honcomp ~ female + read + science, data = hsb2,
family = binomial(link = 'logit'))

blr_plot_leverage_fitted(model)