Skip to contents

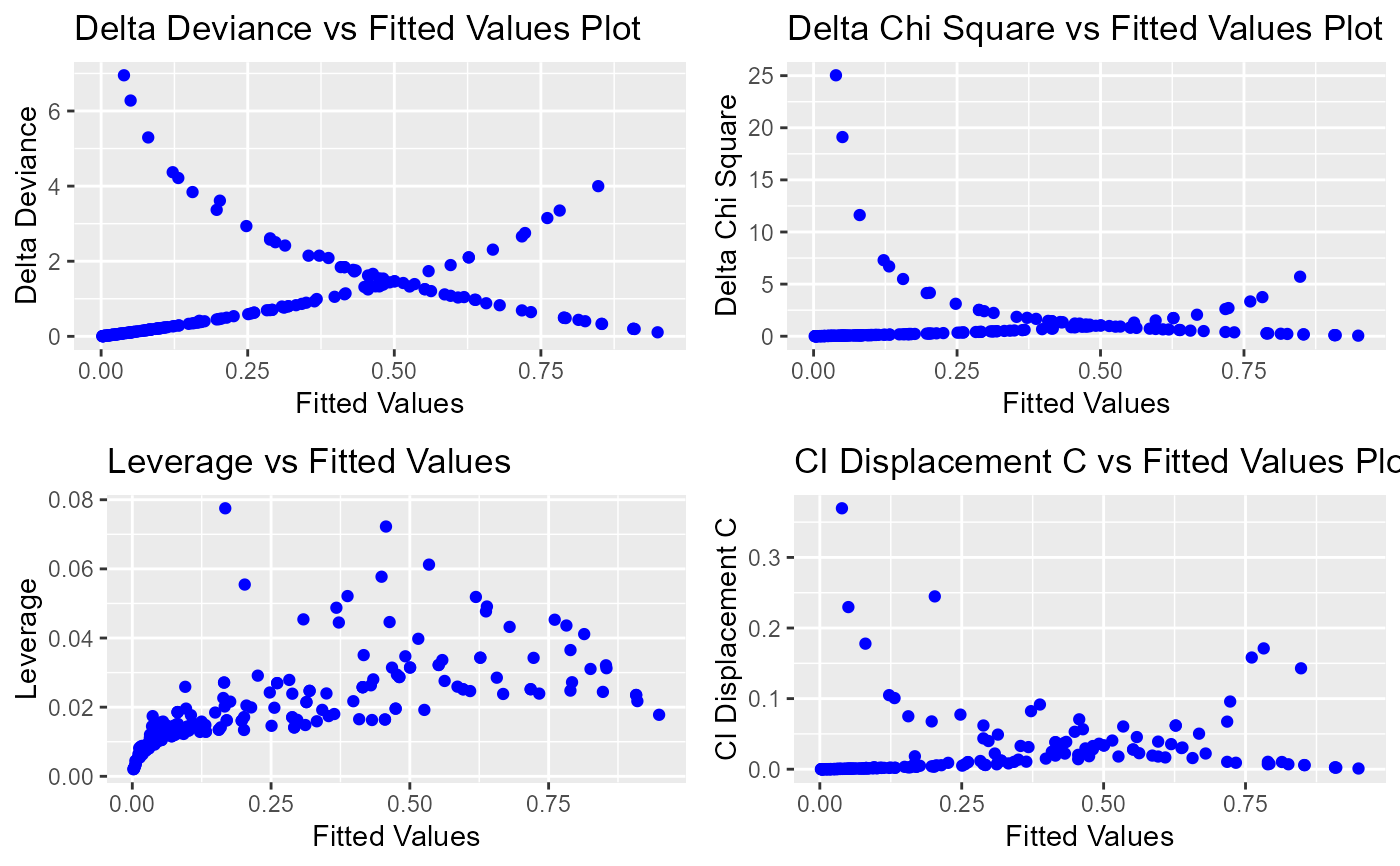
Diagnostic plots for fitted values.

Usage

blr_plot_diag_fit(model, print_plot = TRUE)

Arguments

model

An object of class glm.

print_plot

logical; if TRUE, prints the plot else returns a plot object.

Value

A panel of diagnostic plots for fitted values.

References

Fox, John (1991), Regression Diagnostics. Newbury Park, CA: Sage Publications.

Cook, R. D. and Weisberg, S. (1982), Residuals and Influence in Regression, New York: Chapman & Hall.

See also

Other diagnostic plots: blr_plot_diag_influence(), blr_plot_diag_leverage()
Examples

model <- glm(honcomp ~ female + read + science, data = hsb2,
family = binomial(link = 'logit'))

blr_plot_diag_fit(model)