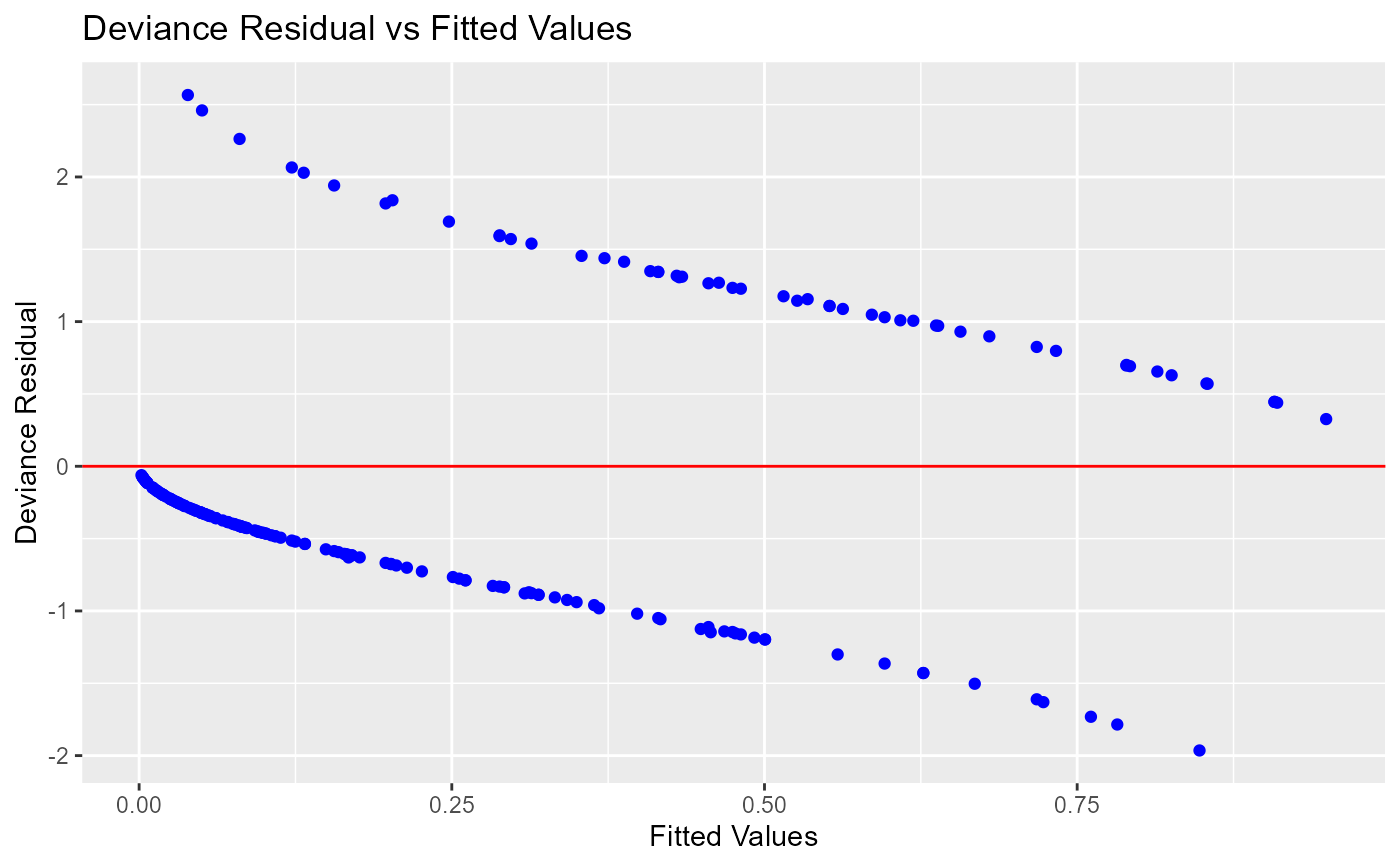
Deviance vs fitted values plot.
Usage
blr_plot_deviance_fitted(
  model,
  point_color = "blue",
  line_color = "red",
  title = "Deviance Residual vs Fitted Values",
  xaxis_title = "Fitted Values",
  yaxis_title = "Deviance Residual"
)
Arguments
- model
An object of class glm.
- point_color
Color of the points.
- line_color
Color of the horizontal line.
- title
Title of the plot.
- xaxis_title
X axis label.
- yaxis_title
Y axis label.
Examples
model <- glm(honcomp ~ female + read + science, data = hsb2,
family = binomial(link = 'logit'))

blr_plot_deviance_fitted(model)