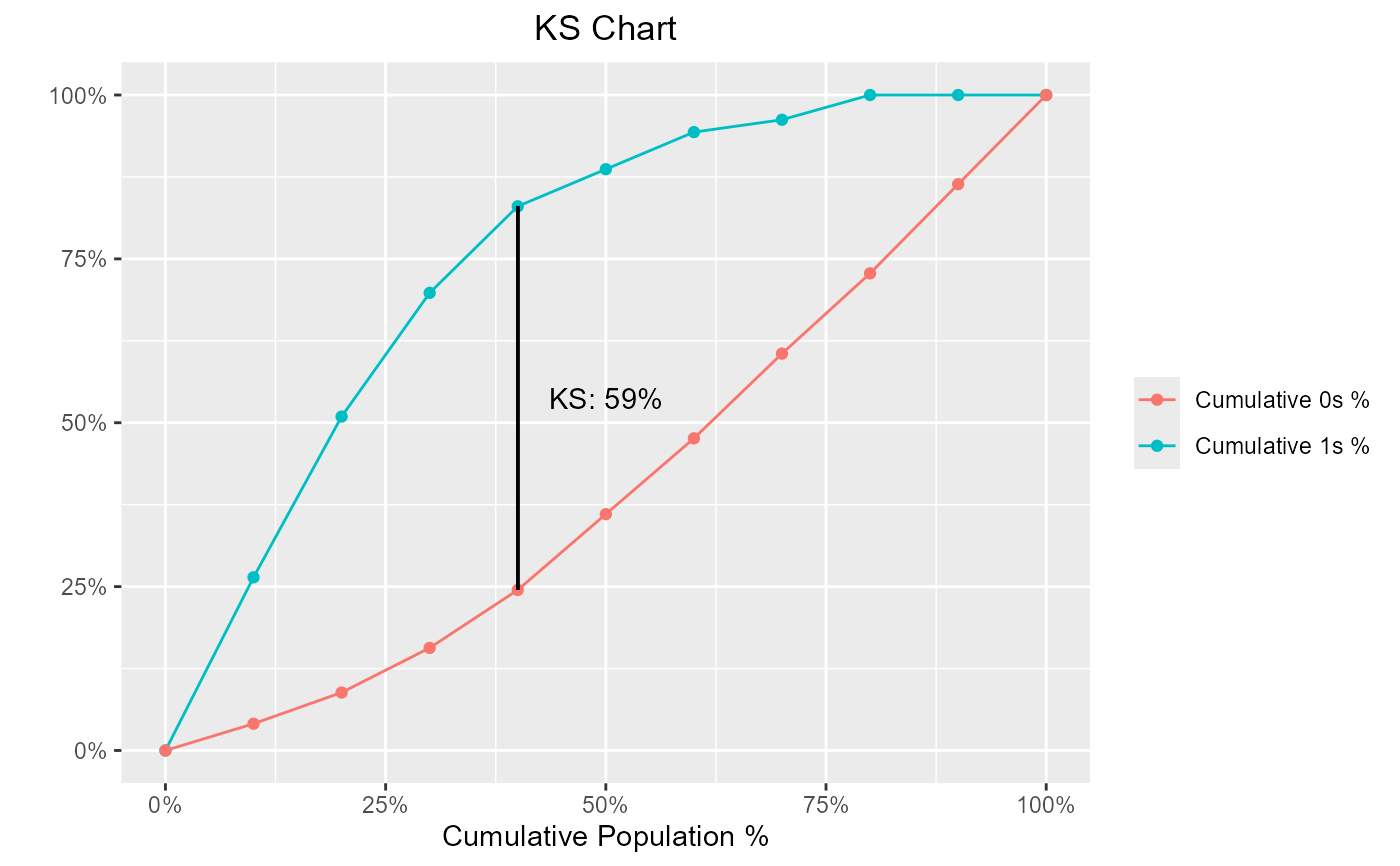
Kolmogorov-Smirnov (KS) statistics is used to assess predictive power for marketing or credit risk models. It is the maximum difference between cumulative event and non-event distribution across score/probability bands. The gains table typically has across score bands and can be used to find the KS for a model.
Usage
blr_ks_chart(
  gains_table,
  title = "KS Chart",
  yaxis_title = " ",
  xaxis_title = "Cumulative Population %",
  ks_line_color = "black",
  print_plot = TRUE
)See also
Other model validation techniques:
blr_confusion_matrix(),
blr_decile_capture_rate(),
blr_decile_lift_chart(),
blr_gains_table(),
blr_gini_index(),
blr_lorenz_curve(),
blr_roc_curve(),
blr_test_hosmer_lemeshow()
Examples
model <- glm(honcomp ~ female + read + science, data = hsb2,
             family = binomial(link = 'logit'))
gt <- blr_gains_table(model)
blr_ks_chart(gt)